Neolithic Immigration: How Middle Eastern Milk Drinkers Conquered Europe. (n.d.). Retrieved February 2, 2015, from http://www.spiegel.de/international/zeitgeist/bild-723310-141465.html
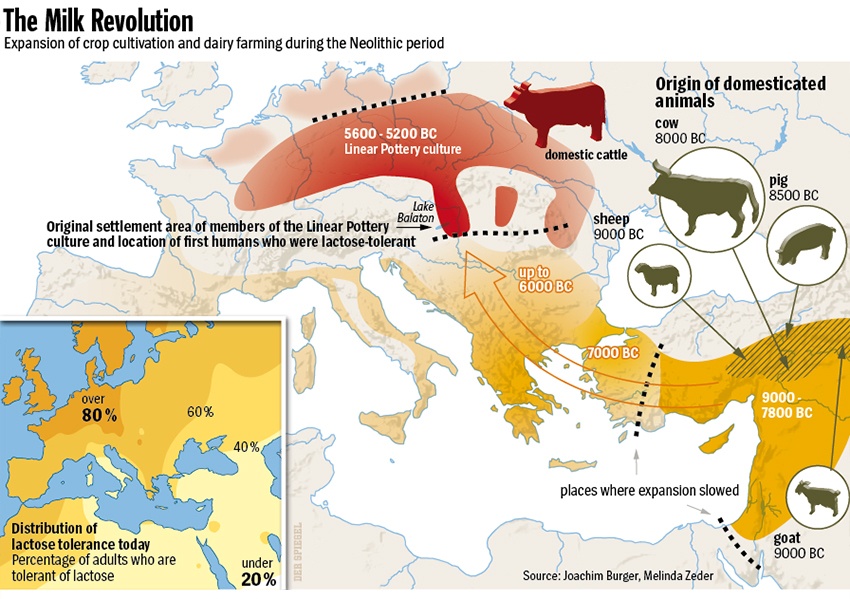
This is a map showing mostly Europe and depicts the spread of resources from the Fertile Crescent. In particular, this illustrates the spread of domesticated animals. Animals were first domesticated with farming and spread with the spread of farming. You can clearly see where Germany is in this map and how long it took for Germany to receive the crops and animals originally in the Fertile Crescent.
This is a map showing mostly Europe and depicts the spread of resources from the Fertile Crescent. In particular, this illustrates the spread of domesticated animals. Animals were first domesticated with farming and spread with the spread of farming. You can clearly see where Germany is in this map and how long it took for Germany to receive the crops and animals originally in the Fertile Crescent.
The Great Rivers of Germany and France. (n.d.). Retrieved February 2, 2015, from http://www.river-cruise-guide.com/germany-france-rivers-map.htm
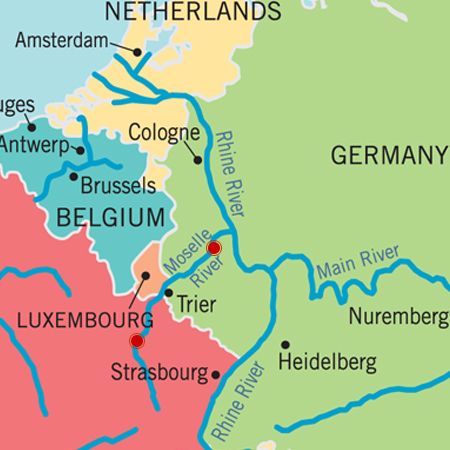
This image shows the Western part of Germany and the Moselle River. The Moselle River is where the first settlement in Germany was ever founded, and this map shows us why. As you can see from the map, the Moselle River as well as the Rhine River provide transportation and irrigation for people living in Trier. The map depicts how the geography of Trier led to the city being settled there.
This image shows the Western part of Germany and the Moselle River. The Moselle River is where the first settlement in Germany was ever founded, and this map shows us why. As you can see from the map, the Moselle River as well as the Rhine River provide transportation and irrigation for people living in Trier. The map depicts how the geography of Trier led to the city being settled there.
MORE INFORMATION:
If you are interested in learning more about Germany's natural resources and first settlements use the links below!
German Resources
This is a great source if you are looking for background information. By clicking on the above link, you will be guided to a page that talks about Germany's natural resources. If you would like to learn more on Germany you can click on the links at the top of the webpage. This is a valuable resource because it provides detailed information on the resources found and how they are used.
German Settlements
This source is great if you need more information on how people came into Europe. The webpage discusses how and why people migrated from Africa and when they ended up in Europe. This is valuable because it provides information on the entire migration of people, and not just the migration of people into Germany.
POPULATION OVER TIME
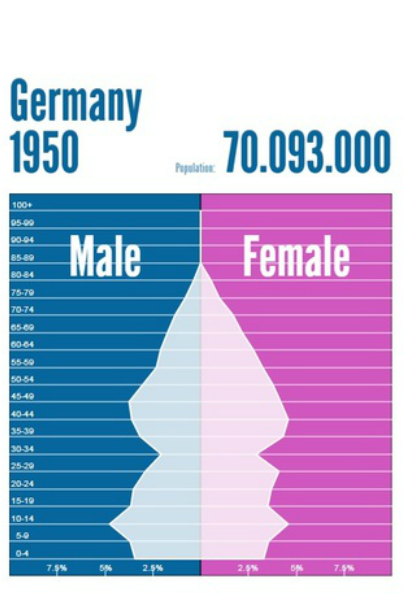
The graph above shows the male and female population in Germany in the year 1950. This graph shows us that there is no one in the country alive over the age of 80. There also appears the be a large amount of children age 10-14 which means that there was a larger amount of children born in the year 1936-1940. During this time, Hitler's reign had encouraged the population to produce more children, which explains why so many children had been born that year. Most of the population is also centered around adult men and women in their 40's. The shape of this graph is odd but looks to resemble a Christmas tree, although most of the population seems to have an even amount of people in each age group.
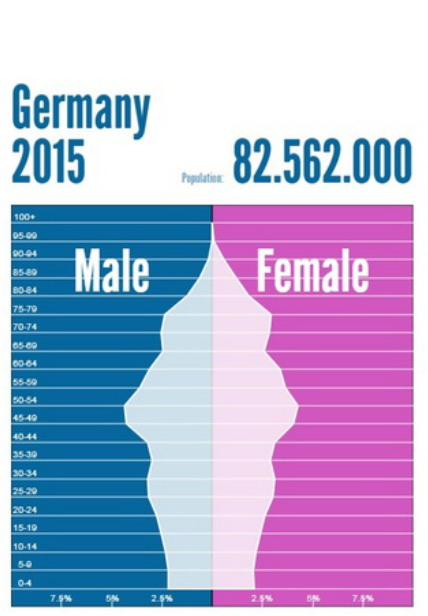
This graph shows the German male and female population this year. You can clearly see a Christmas tree shape which signifies that the birth rate is dropping and the country is becoming more developed. The death rate has increased since the 1950 graph and the majority of the population is in their late 40's and early 50's. Now, the oldest person who dies is around 99 years old.
